
Article
Carbs, sugars, fibre: what the database really separates
The Swiss database does not group carbohydrates the way most people assume: fibre is counted separately, and the “of which sugars” line never adds to the total. Here is what each line holds, and how to read the gap between carbohydrates and sugars on real foods.
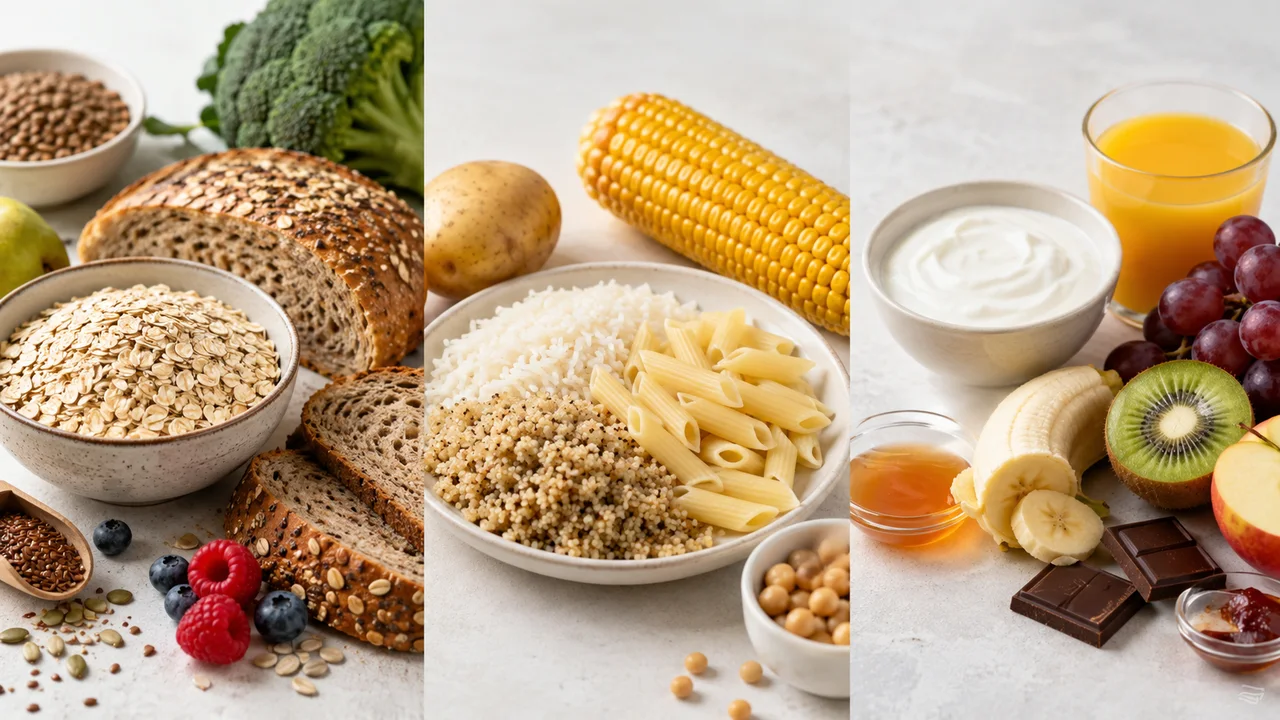
Three lines, one official hierarchy
In the FSVO database, the “carbohydrates” line does not cover every carbohydrate in a food: it reports available carbohydrates, essentially sugars and starch. Sugars form a sub-line of that total. Dietary fibre sits on a line of its own: non-digestible carbohydrates of plant origin, which the Swiss database does not count among available carbohydrates.
The consequence is concrete: on a food page, carbohydrates and fibre do not overlap. For raw banana, the database lists 19.7 g of carbohydrates and 2.7 g of fibre per 100 g: two separate amounts, not two ways of counting the same thing.
The adult reference values follow the same structure: 260 g of carbohydrates a day, of which 90 g sugars, plus 30 g of fibre counted apart.
Carbohydrates and sugars: reading the gap
Four foods are enough to show that the two lines do not sit on top of each other.
| Food (100 g) | Carbohydrates | of which sugars | Fibre |
|---|---|---|---|
| Banana, raw | 19.7 g | 15.6 g | 2.7 g |
| Potato, peeled, raw | 15.6 g | 0.7 g | 2.1 g |
| Rice polished, cooked in salted water | 25.8 g | 0.1 g | n/a |
| Chocolate, dark | 53.4 g | 50 g | n/a |
For peeled raw potato, the total is close to the banana’s, yet sugars make up only a sliver of it: the rest is mostly starch. Cooked white rice widens the gap further, with 0.1 g of sugars for 25.8 g of carbohydrates. Dark chocolate runs the other way: 50 g of sugars out of 53.4 g of carbohydrates, against the 90 g daily reference value. “n/a” marks a value missing from the source, never a zero.
What “of which” actually means
“Of which” always introduces a subset. A food with 19.7 g of carbohydrates, of which 15.6 g sugars, does not contain 35.3 g of carbohydrates: the sugars are already inside the 19.7 g. The same rule applies to the “of which saturated fat” line under fat. Adding a line to its own sub-line is the most common reading mistake.
Second point: the “sugars” line is a total. It pools the sugars naturally present in the food with those added during manufacture; no separate figure for added sugars exists. The highest contents in the whole database therefore come from products made almost entirely of sugar: white sugar at 100 g per 100 g, glucose at 99.8 g, brown sugar at 97.6 g, hard caramels at 95 g and the meringue shell at 92.3 g.
Fibre: where the database finds the most
Across the 1,216 generic foods in the database, the highest fibre contents cluster in dry or concentrated products: agar agar leads with 74.1 g per 100 g, ahead of wheat bran (45.1 g), dried rosemary (42.6 g), chia seed (40.9 g) and dried nori seaweed (36.3 g). Then come instant coffee powder (34.1 g), unsweetened cocoa powder (29.5 g), linseed (26.9 g) and dried green beans (25.3 g).
Every one of those figures is per 100 g, the only comparable basis. But 100 g of dried rosemary or coffee powder matches no real intake. The ranking of the highest-fibre foods shows the full list with the share of the reference value, and can be filtered by family. Fresh foods sit far lower: raw banana comes in at 2.7 g and peeled raw potato at 2.1 g per 100 g.
An NRV for carbohydrates, an indicative value for fibre
The percentages shown on this site relate each content to an adult reference value. For carbohydrates (260 g a day) and sugars (90 g), those values appear in annex 10 of the Swiss ordinance on food information (FIC ordinance): they are set in law, and they are the same ones behind the percentages on Swiss labels.
For dietary fibre, that annex sets no value at all. The 30 g a day used here is an indicative value: it helps place a content in context, without carrying the legal status of an NRV. The percentage next to a fibre content should therefore be read as an order of magnitude. These choices are documented in the methodology; the needs calculator recomputes the benchmarks, and the food comparison tool puts all four lines side by side.