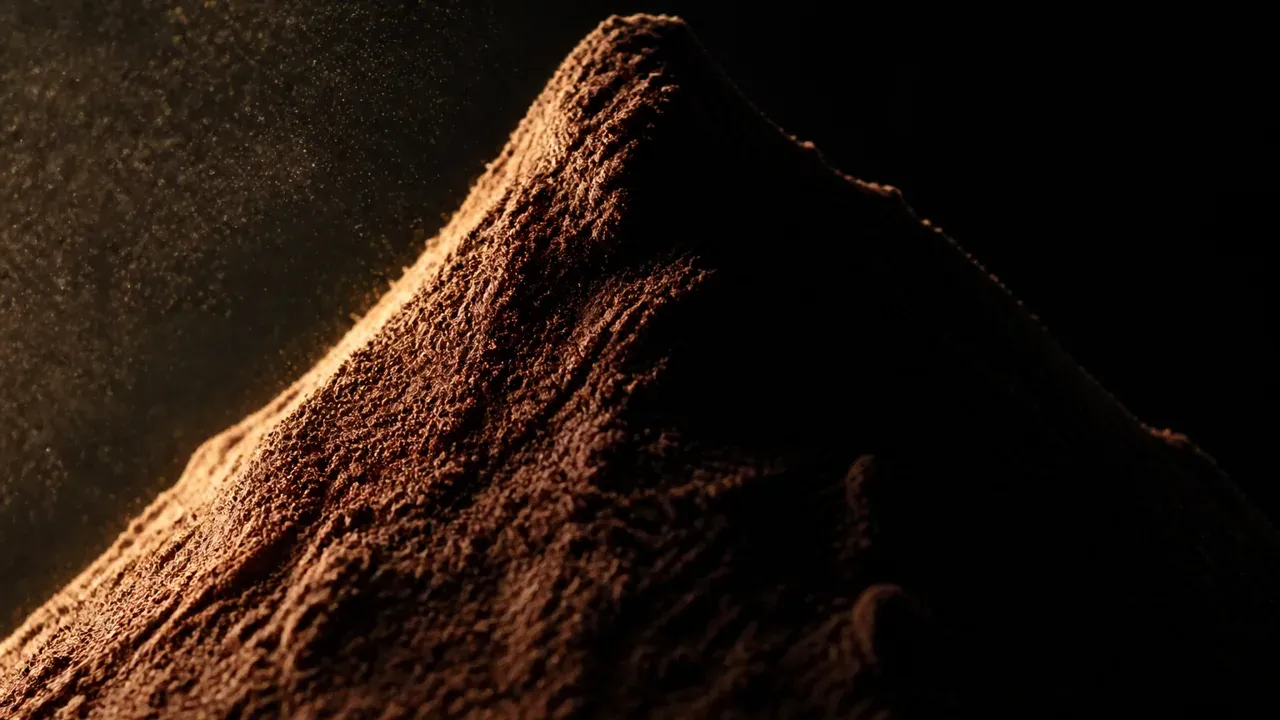
Which food is highest in magnesium? In the Swiss food composition database published by the FSVO, the answer is not pumpkin seeds, the usual winner of English-language lists, but deoiled, unsweetened cocoa powder, which also heads the iron ranking. Its 600 mg of magnesium per 100 g look striking until you weigh what a spoonful actually delivers. Here is how to read that number, and what it leaves out.
Updated 30 July 2026
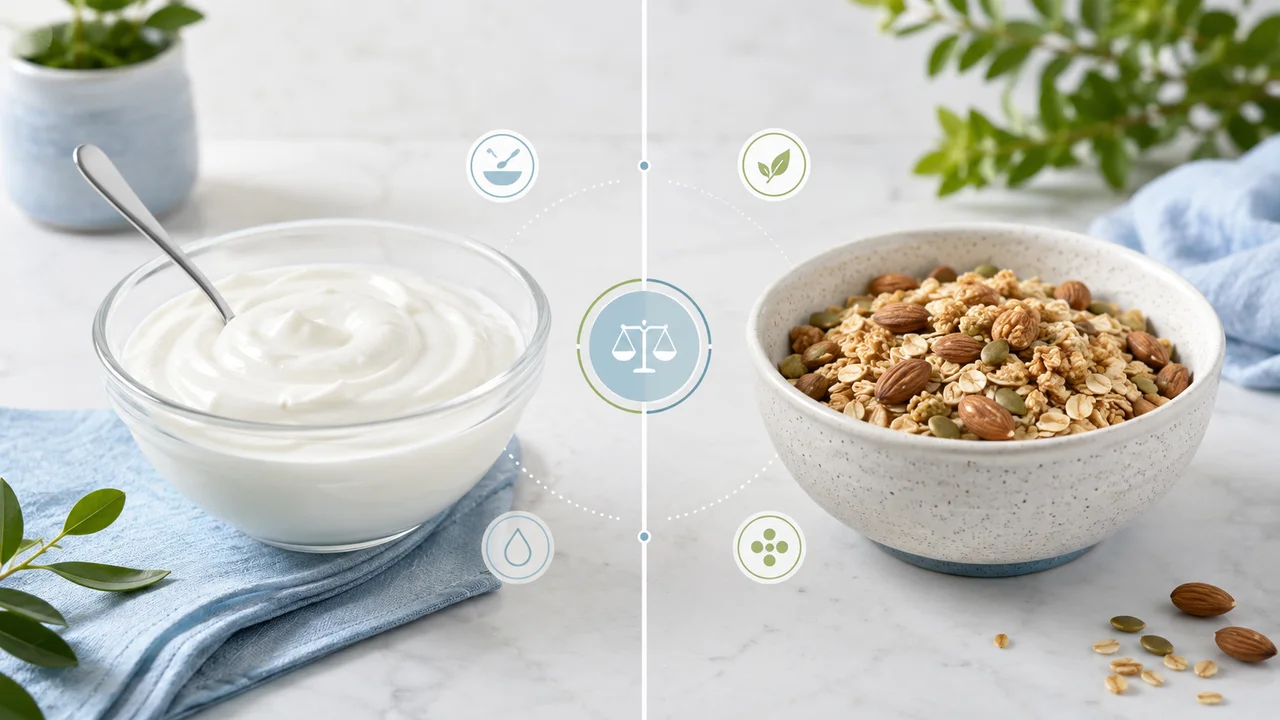
Two foods side by side looks simple: one number against another. In practice, four details decide what the result means: the preparation state, the basis used, the empty cells and where each figure comes from. Here is how to read a comparison, with figures from the FSVO database.
Updated 26 July 2026

In the official Swiss database there is no plain “rice”: there is dry rice and cooked rice, two separate entries with very different numbers. The preparation state is part of the food’s name, and it shifts every value per 100 g. Here is how to read it.
Updated 26 July 2026

On a label as in the FSVO database, energy appears twice: in kilojoules and in kilocalories. One quantity, two units, one fixed conversion factor. Here is what each number measures, where it comes from, and why 2,000 kcal is not your personal requirement.
Updated 26 July 2026
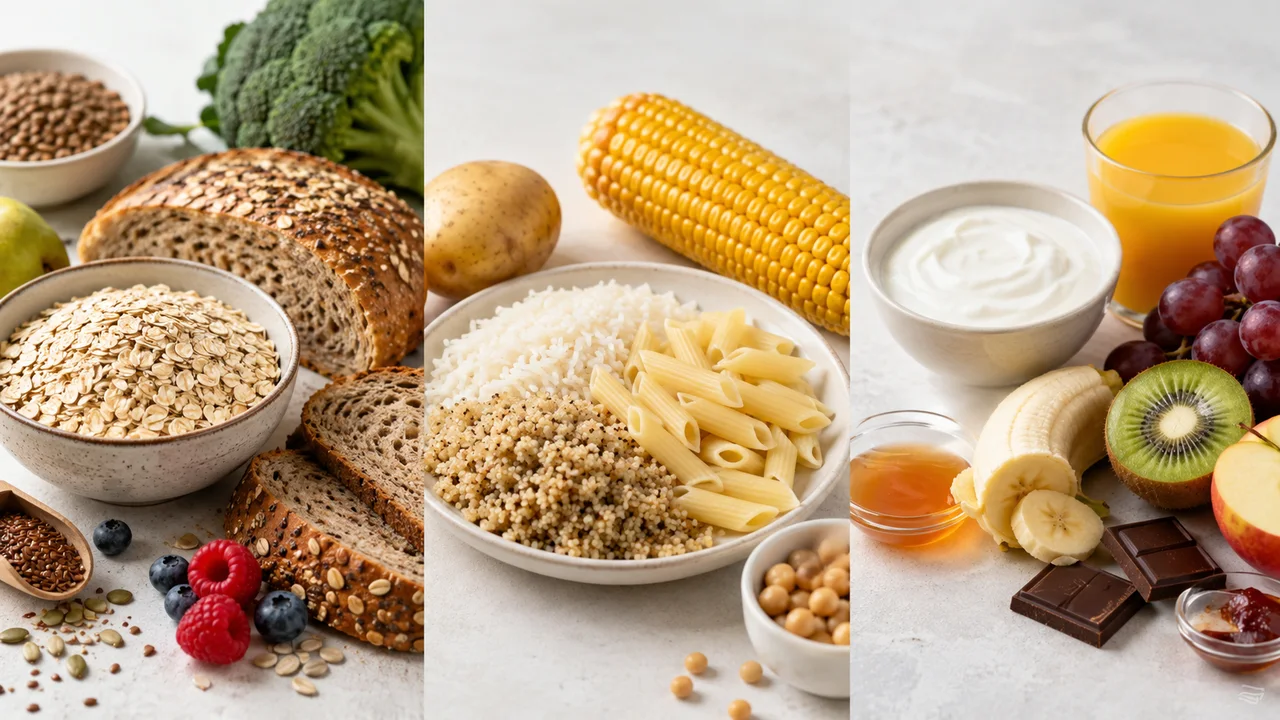
The Swiss database does not group carbohydrates the way most people assume: fibre is counted separately, and the “of which sugars” line never adds to the total. Here is what each line holds, and how to read the gap between carbohydrates and sugars on real foods.
Updated 26 July 2026
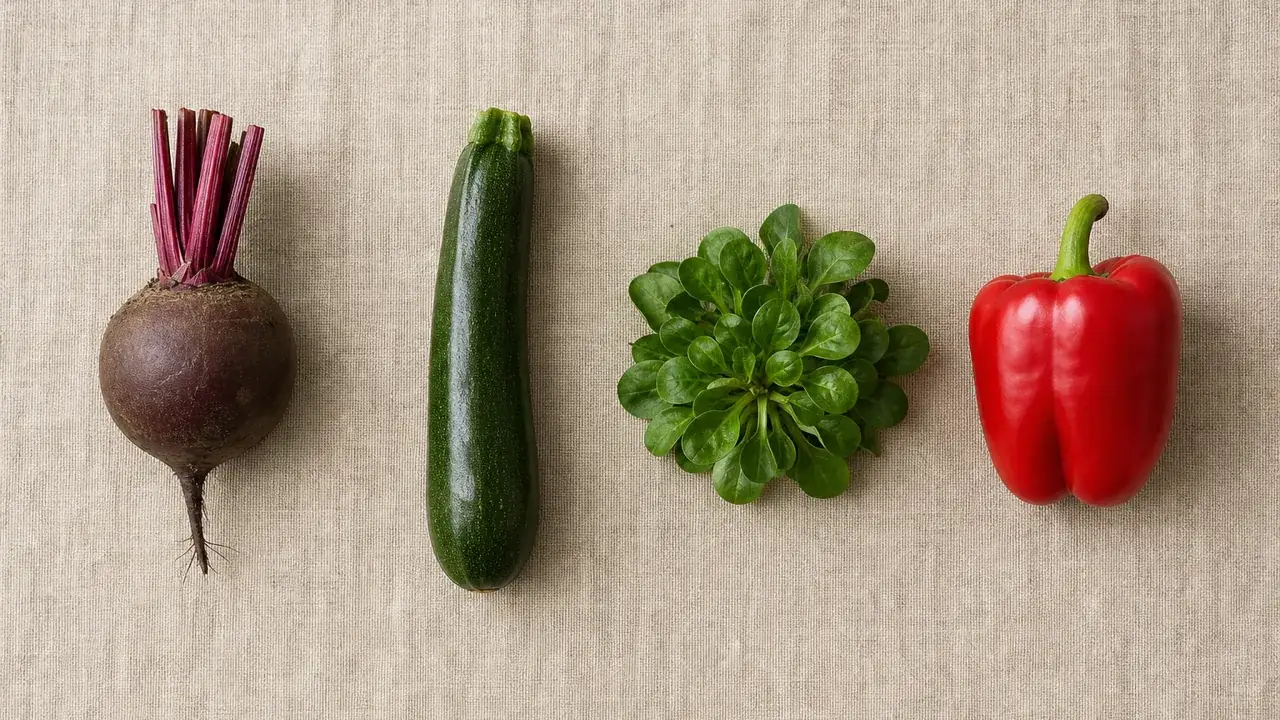
Shopping or cooking in Switzerland comes with its own food vocabulary: beetroot is Rande, zucchini is Zucchetti, lamb’s lettuce is Nüsslisalat, and a Peperoni is a bell pepper, not a pizza salami. The official labels of the Swiss food composition database, published by the FSVO, follow this Swiss usage rather than the dictionaries of Germany or France. This glossary walks through the words that puzzle English speakers most, their equivalents abroad, and the food actually hiding behind each name.
Updated 30 July 2026
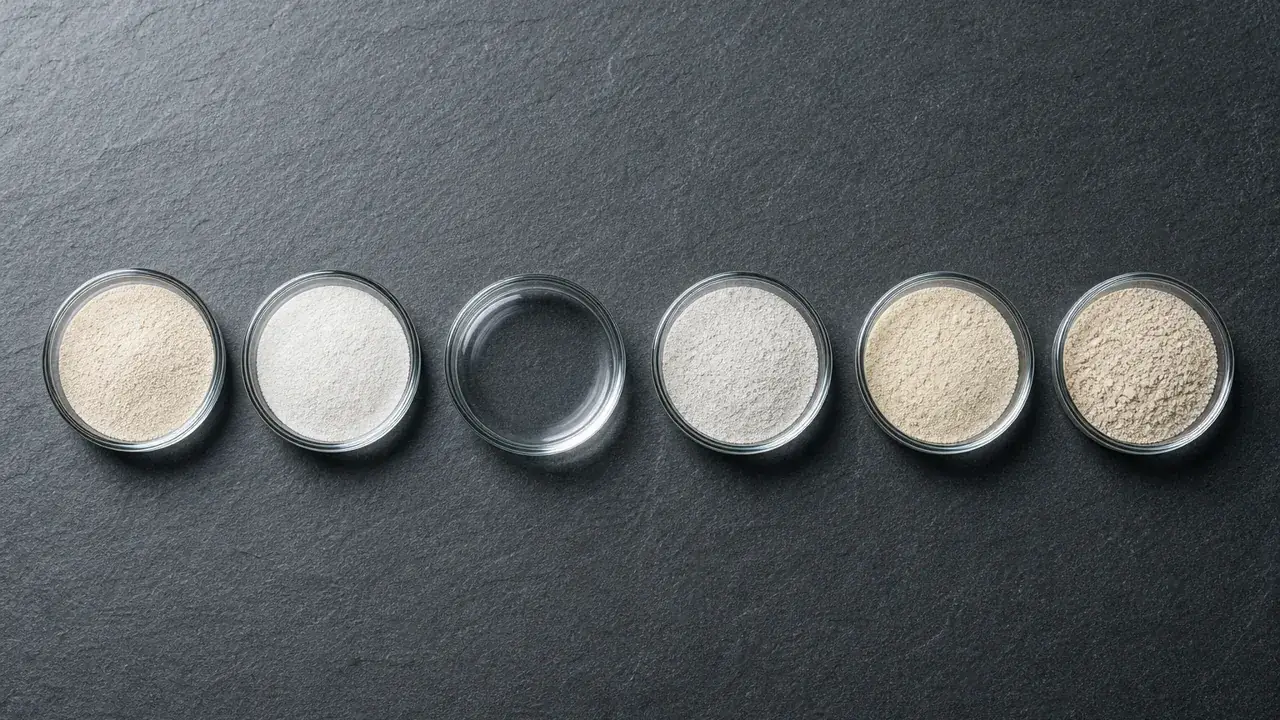
Some cells on a datafood page stay empty, and N/A appears in most nutrition tables. Neither is a hidden zero: the value was never measured for that food. The Swiss FSVO database records missing values openly, through traces, less than markers and unavailable entries; no average is imputed to fill them.
Updated 30 July 2026
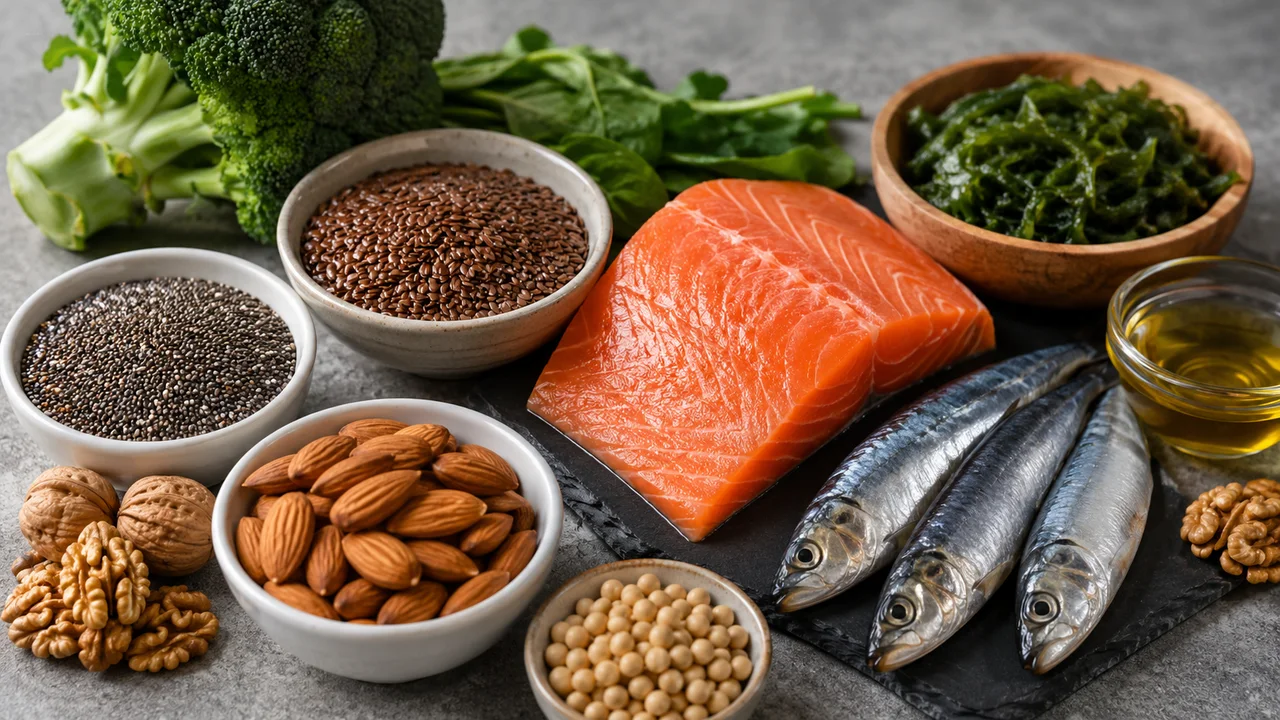
Omega-3 is a family of polyunsaturated fatty acids. Three of them come up again and again: ALA from plant sources, EPA and DHA from the sea. The Swiss database does not show the three forms separately, only their sum. Here is how to read that single figure, and what it leaves out.
Updated 26 July 2026

Every figure in the FSVO database carries a letter: A for measured, E for estimated, C for calculated. That small marker says how the value was obtained: in a laboratory, by estimation or by calculation. Here is what it means, and what it changes when you read a food page.
Updated 26 July 2026
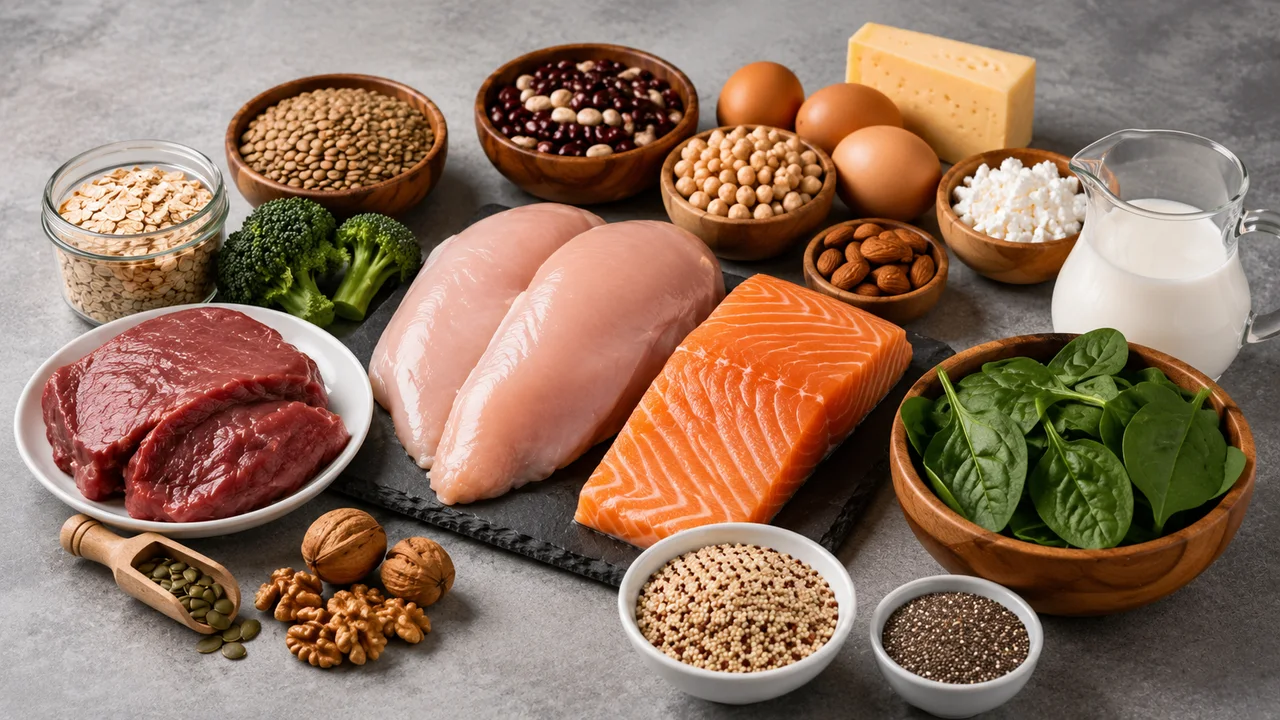
In the Swiss food composition database, “protein” is one column out of 22: a quantity in grams per 100 g of food. Here is what that figure actually measures, why dried products top the ranking, and how to read it without mistaking the weight it refers to.
Updated 26 July 2026

Weighed dry, white rice and egg pasta are almost tied on calories; boiled, each 100 g carries around a third of that energy, and the ranking can flip with the records chosen. The difference is water absorbed during cooking. Here are the four official Swiss FSVO records, read on an equal footing: uncooked against uncooked, cooked against cooked.
Updated 30 July 2026
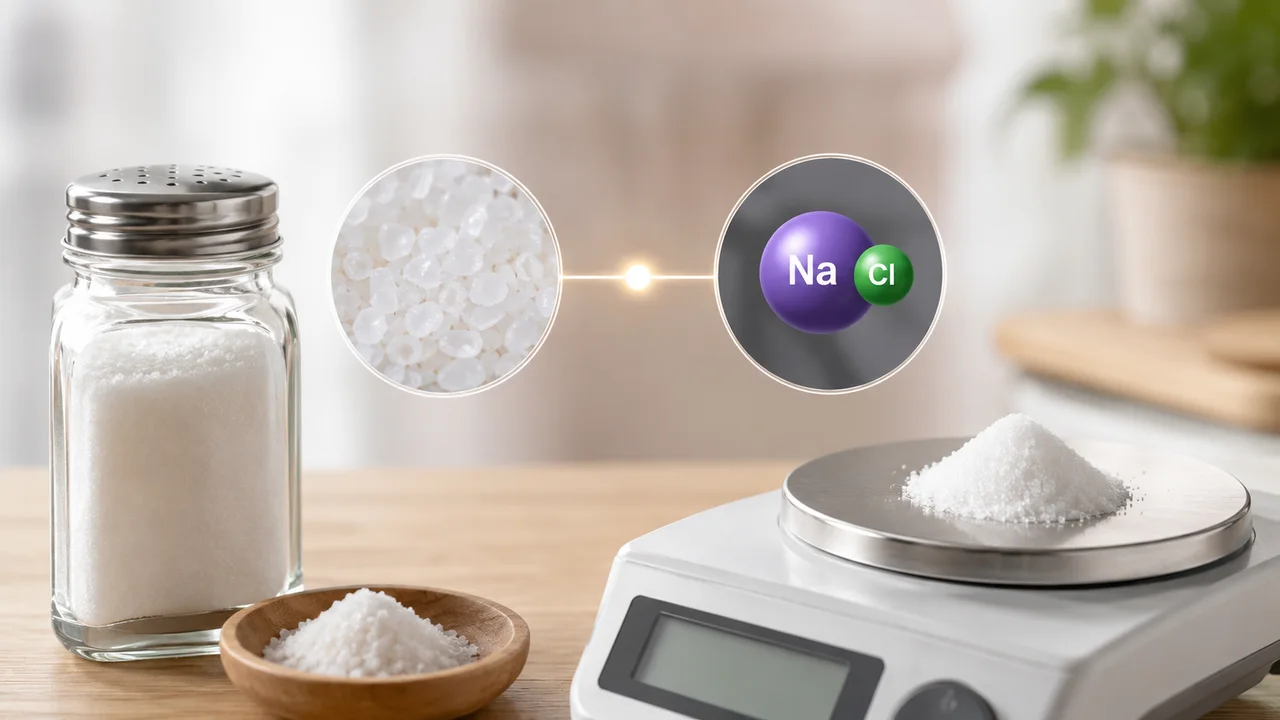
A Swiss label states salt in grams; the FSVO database states sodium in milligrams. They are two ways of writing the same measurement, linked by one fixed factor. Here is how to move from one to the other, and how to read each figure for what it is.
Updated 26 July 2026

Search for honey vs sugar calories and two apparently contradictory answers come back: honey lists fewer calories per 100 g, yet a tablespoon of honey can carry more calories than a tablespoon of sugar. Both readings are correct, and the official Swiss records explain why. In the FSVO food composition database, white sugar lists 400 kcal per 100 g and blossom honey 306, a gap written right on the entry itself: honey contains 20 g of water per 100 g, sugar none. Here is how to read those figures without making them say more than they do.
Updated 30 July 2026
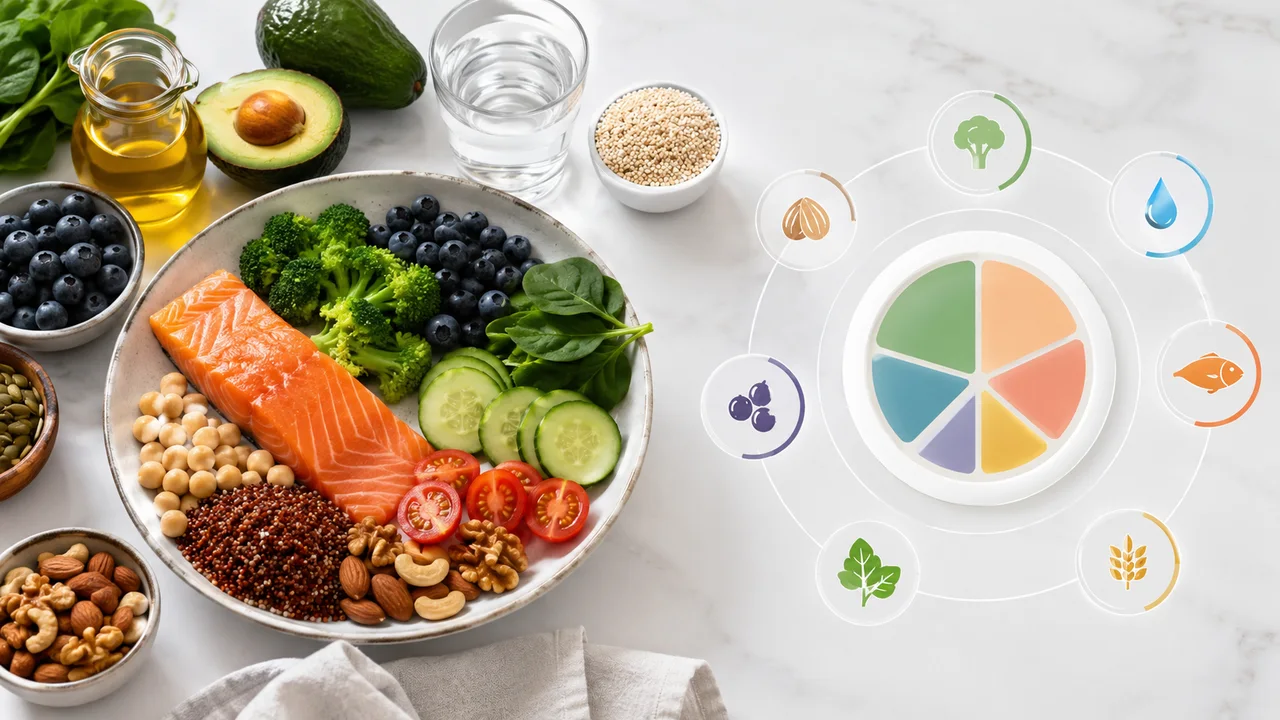
On every food page of this site, a “% NRV” column sits next to the values per 100 g. That percentage compares the food’s content with a reference amount set for an average adult. Here is what it measures, and what it does not.
Updated 26 July 2026

On this site, as on every Swiss label, each figure refers to 100 g. That is no accident: only a fixed quantity makes two foods comparable. What remains is the second step: turning those theoretical 100 g into the plate actually in front of you.
Updated 26 July 2026