
Article
Where protein is found: reading the Swiss values
In the Swiss food composition database, “protein” is one column out of 22: a quantity in grams per 100 g of food. Here is what that figure actually measures, why dried products top the ranking, and how to read it without mistaking the weight it refers to.
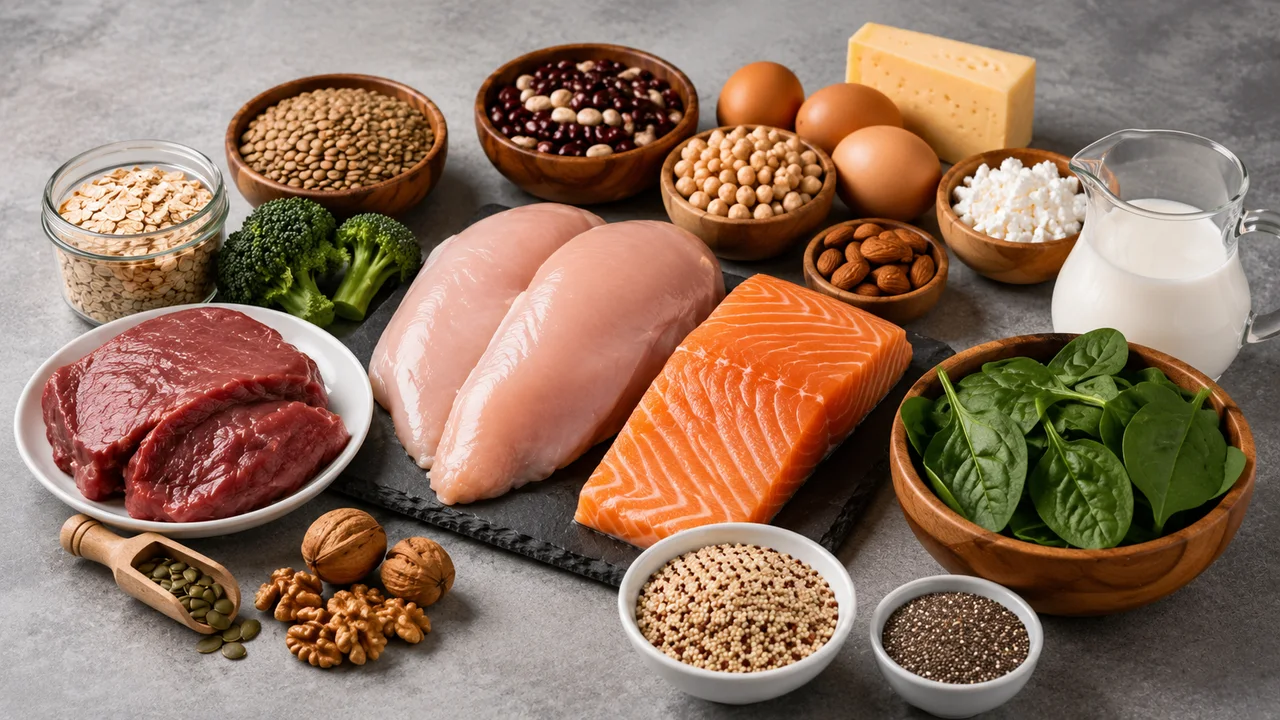
What the “protein” column measures
On this site, “protein” is a quantity: grams per 100 g of the food as its official name describes it. The figure ranks nothing and says nothing about amino acid composition. It is one of 22 components published for each of the 1,216 generic foods in the FSVO database.
Two benchmarks come with it. First, the nutrient reference value for adults: 50 g of protein per day, set in annex 10 of the Swiss ordinance on food information. It is the denominator of every percentage shown here. Second, the origin flag beside each value: A for measured, E for estimated, C for calculated. Across the database, 34% of values are measured, 14% estimated and 53% calculated. Where the source publishes nothing, the cell reads “n/a” and stays empty; we never estimate in its place (methodology).
Why dried products sit at the top
Sorted by decreasing content, the top of the database is held by dried or dehydrated products: defatted soya flour at 51.5 g per 100 g, dried textured soya at 49.9 g, dried brewer’s yeast at 47.9 g, and Swiss dried meat at 39.3 g.
This is a concentration effect, not a hierarchy. Content refers to 100 g of weight, water included: when water leaves, everything else packs into the same weight. Dried lentils hold 9.7 g of water and 24.4 g of protein per 100 g; cooked lentils, having taken water back up (68.7 g), show 8.8 g. The seed is identical; only the weighing changed. The protein ranking therefore also describes a preparation state. Further down the list the pattern holds: dried soybean at 38.2 g, skimmed milk powder at 34.3 g (both low-water products as well).
The plant side: soya, seeds, dried pulses
Three groups stand out. Soya and its products first: defatted flour 51.5 g, dried textured soya 49.9 g, full-fat flour 40.8 g, dried soybean 38.2 g per 100 g. Then seeds and nuts: pumpkin seeds 35.6 g, peeled sesame seeds 26.8 g, peanut 26.1 g. Next, wheat-based items: vegan seitan sausage 29.1 g, seitan 28 g. Dried pulses follow, at 27 g for split lentils.
All of these share one trait: they hold little water. Against the 50 g reference value, the 27 g of dried split lentils amount to 54% per 100 g of weight, but 100 g of dry lentils becomes far more than 100 g once cooked, and the figure shown drops accordingly. At this point the database reports contents only, with no judgement on the source.
The animal side: cooking losses, powders, cheeses
Three families mix here. First, meat weighed after cooking: braised pork knuckle 36.6 g per 100 g, roast beef shoulder 33.1 g, pan-fried pork round 33 g, pan-fried minced beef 32.6 g, pan-fried turkey breast 31.8 g. The words “braised”, “roast” or “pan fried” in the official name point to exactly that: weighing after water has gone.
Then concentrated dairy: skimmed milk powder 34.3 g, quarter-fat Appenzeller 33.1 g, Schabziger herb cheese 31.6 g. Fish appears further down the list because it holds more water: raw tuna shows 25.8 g per 100 g, or 52% of the 50 g reference value, and raw farmed salmon 19.9 g. The animal top runs from 31.3 to 36.6 g, a band that also holds pumpkin seeds (35.6 g).
The limit of “per 100 g”
The 100 g basis is the only one that makes two foods comparable, yet it says nothing about the amounts actually weighed. Two simple sums show it: 100 g of cooked lentils holds 8.8 g of protein, so 17.6 g at 200 g of weight; defatted soya flour states 51.5 g per 100 g, so 10.3 g at 20 g of weight. The order changes with the amount considered.
Two tools carry the reading further. The food comparison lines up every row of two foods per 100 g: raw tuna (25.8 g of protein, 114 kcal) and raw farmed salmon (19.9 g, 223 kcal) swap places depending on which row you read. The needs calculator expresses reference values for a given profile, and the portion selector on each food page recalculates the content gram by gram.