
Article
Salt and sodium: two figures, one and the same
A Swiss label states salt in grams; the FSVO database states sodium in milligrams. They are two ways of writing the same measurement, linked by one fixed factor. Here is how to move from one to the other, and how to read each figure for what it is.
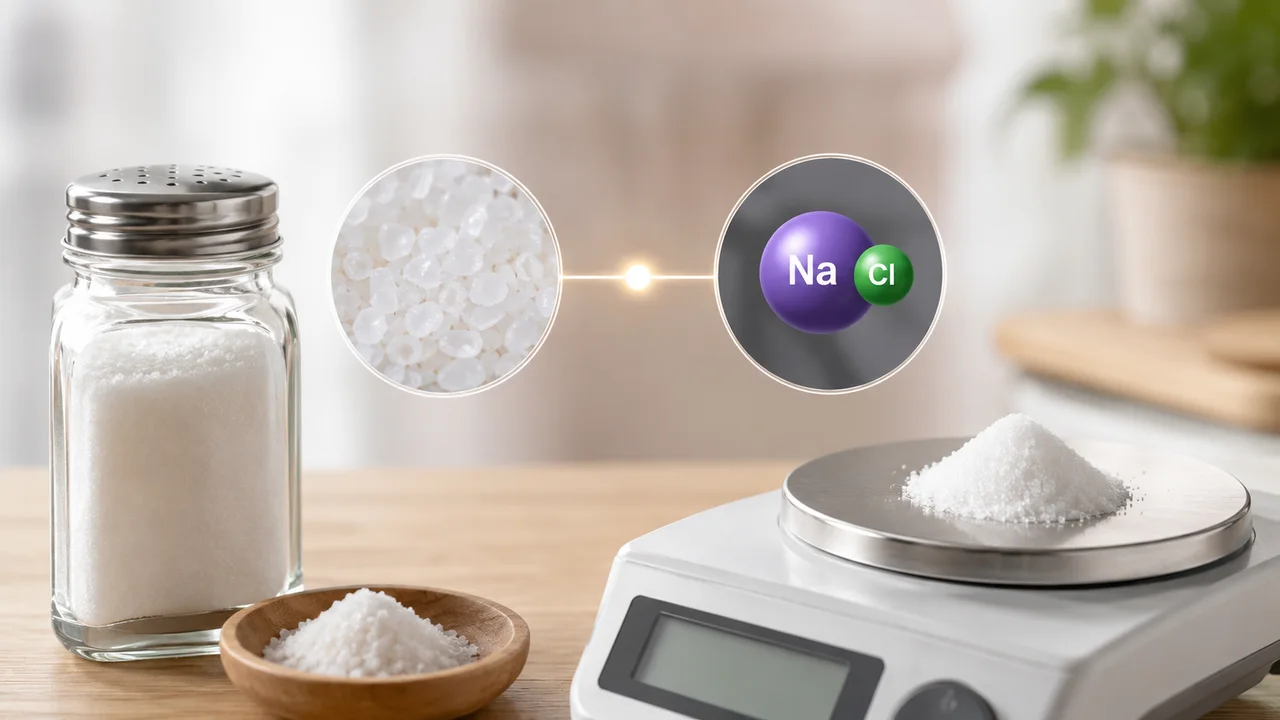
Salt = sodium × 2.5: the same fact, two units
Sodium is a mineral: a chemical element measured directly, in milligrams. Table salt is a compound, sodium chloride (NaCl), in which sodium is only one part. Hence a constant conversion factor: salt = sodium × 2.5.
The ratio holds row by row:
| Food | Sodium per 100 g | Salt per 100 g |
|---|---|---|
| Table salt, iodized | 39,200 mg | 98 g |
| Raw ham | 1,760 mg | 4.4 g |
| Semi-white bread | 680 mg | 1.7 g |
| Parmesan cheese | 650 mg | 1.6 g |
1.76 g of sodium × 2.5 = 4.4 g of salt; 0.68 × 2.5 = 1.7 g. For parmesan the arithmetic gives 1.625 g, published as a rounded 1.6 g: rounding is the only gap between the calculation and the printed value. And the unit matters as much as the factor: 400 mg of sodium is 1 g of salt.
Why labels say “salt” and databases say “sodium”
The Swiss nutrition declaration speaks to the shopper: it states salt, in grams, because salt is what goes into the pan. A composition database describes the food that was analysed: it measures the element sodium, just as it measures calcium or potassium. Each choice fits its own purpose.
You can see it in the origin indicators. For the four foods above, the salt value carries a C (calculated): it is derived from sodium. Sodium itself is measured (A) for raw ham, parmesan and table salt, and calculated for semi-white bread. What those letters mean is set out in the site methodology.
One rule follows: never compare a salt figure with a sodium figure. Convert one side first.
Where sodium concentrates in the database
Sorted by sodium content, the top of the database is salt itself: the first six rows are table salt, sea salt and himalaya salt, between 37,900 and 39,900 mg per 100 g, all in the “Various” family. The arithmetic closes the loop: 39.9 g of sodium × 2.5 is close to 100 g of salt per 100 g of product.
Then comes a clear step down: anchovy paste 7,720 mg, soy sauce 5,490 mg, drained anchovies in oil 4,970 mg, bresaola 2,730 mg. Three families recur: “Various”, “Fish” and “Sausages and cold meats”. Further down: 1,760, 680 and 650 mg for raw ham, semi-white bread and parmesan.
Potassium, another database mineral expressed in milligrams, reads exactly the same way: see the ranking by potassium content per 100 g.
Naturally present or added: the database does not say
The database publishes total sodium: what an analysis finds in the food as described, with no column separating the sodium of the raw material from sodium brought in by salting, brine or a sauce. The figure does not say where it came from.
Two reading precautions follow. First, the official label is part of the data: “anchovy in oil, drained” is not “anchovy in oil”, and the state of preparation changes the content per 100 g. Second, a value can be missing: the database then shows “n/a” (not available) and never an estimate of our own; a very small content appears as “traces”.
Among the 22 components published for each food, sodium reads like the rest: a content per 100 g, in a stated condition, with no judgement attached.
Placing a figure: reference value and comparison
To turn a figure into a benchmark, the database uses the adult nutrient reference value (NRV), the same one behind the percentages on every page: 2,400 mg of sodium a day, which the same factor writes as 6 g of salt. It is a calculation basis shared by every food, not a personal target.
Two readings are then available. The share of the NRV, shown next to the value for the chosen portion. Or a direct comparison, two foods side by side with every row aligned: the job of the food comparison tool. The needs calculator places energy and macronutrients against your own profile.
None of these tools says what to eat: they describe composition, figure by figure.