
Article
ALA, EPA, DHA: the three forms of omega-3 in food
Omega-3 is a family of polyunsaturated fatty acids. Three of them come up again and again: ALA from plant sources, EPA and DHA from the sea. The Swiss database does not show the three forms separately, only their sum. Here is how to read that single figure, and what it leaves out.
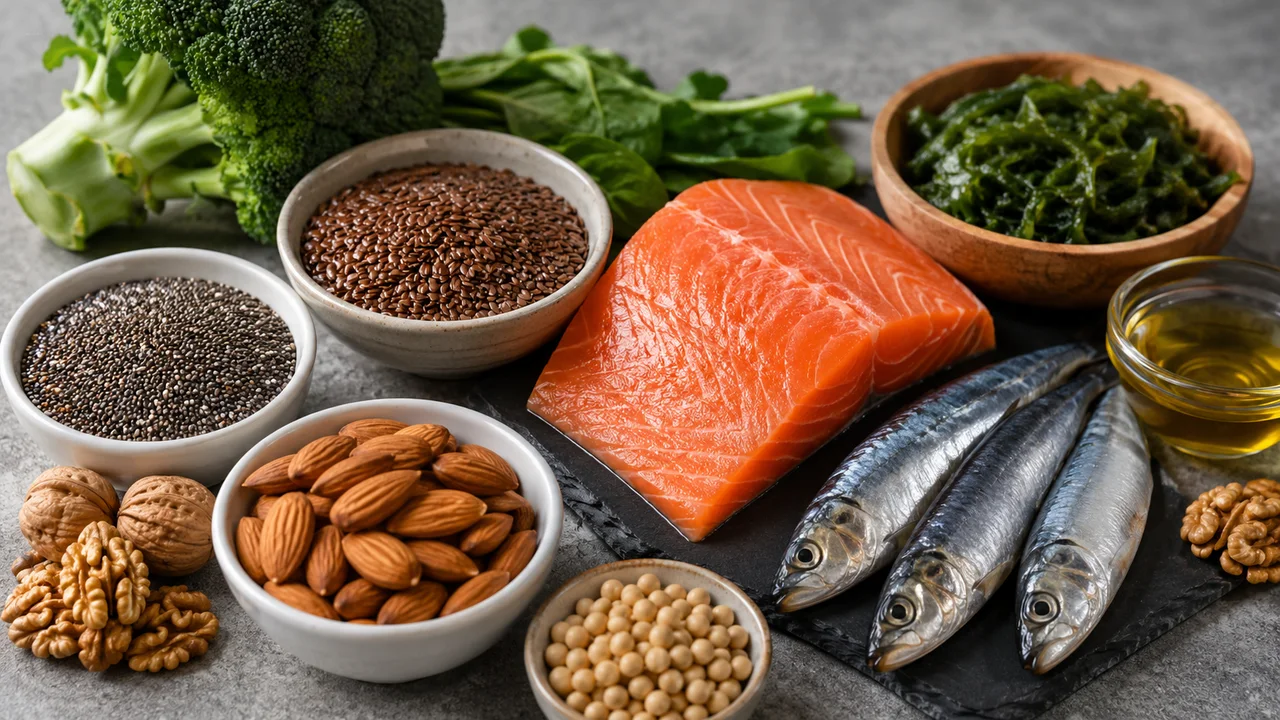
One fatty-acid family, three forms to tell apart
Omega-3 fatty acids are polyunsaturated fatty acids: fats whose carbon chain carries several double bonds. In the Swiss food composition database they appear as a sub-line of fat: “Fat”, then “of which polyunsaturated”, then “of which omega-3”.
Three forms account for most of the recorded contents:
- alpha-linolenic acid (ALA), found mainly in oils, seeds and nuts;
- eicosapentaenoic acid (EPA) and docosahexaenoic acid (DHA), found mainly in fish and seafood.
These are three distinct molecules with chains of different lengths. A plant food and a fish can therefore show similar contents while supplying different forms. The ranking of foods highest in omega-3 deliberately mixes both origins: the sorting criterion is the total content, never the split between ALA, EPA and DHA.
The database keeps a single omega-3 line. The figure alone does not say which of the three forms lies behind it: for that, the origin of the food is the clue.
How the displayed content is obtained
The omega-3 line is the only quantity datafood computes itself. It is the sum of the alpha-linolenic (ALA), eicosapentaenoic (EPA) and docosahexaenoic (DHA) acids provided by the source, nothing more. That is why the value always carries the C (calculated) indicator, never A (measured) or E (estimated), even when the underlying columns are themselves measured. The rule is published in the methodology.
One practical consequence: if the source fills in only one of the three columns, the sum covers only that one. If none is, the page shows “n/a”, not available in the source, never filled in by us.
A second limit: the annex of nutrient reference values used by this site sets no value for omega-3. The percentage column therefore stays empty on this line, unlike protein (50 g) or magnesium (375 mg). The needs calculator covers energy and the macronutrients, not individual fatty acids.
Plant side: oils and seeds at the top
The highest omega-3 contents in the database all come from the plant side: oils and seeds take the leading places. As everywhere, the values apply to the food in the state named. Per 100 g:
| Food | Omega-3 per 100 g |
|---|---|
| Flaxseed oil, cold pressed | 49.82 g |
| Linseed | 21 g |
| Chia seed | 19.25 g |
| Hempseed oil | 18.75 g |
| Walnut oil | 11.9 g |
| Rapeseed oil | 8.54 g |
| Walnut | 7.5 g |
| Mayonnaise with rapeseed oil, home-made | 7.09 g |
Cold-pressed flaxseed oil opens the list at 49.82 g per 100 g, close to half its mass. Chia seeds record 19.25 g. Home-made rapeseed-oil mayonnaise, at 7.09 g, makes a useful reading point: a composite dish inherits the profile of its main fat ingredient. The gap between an oil and its seed is striking too: flaxseed oil sits at 49.82 g, linseed at 21 g. The same raw material, two very different lines.
Fish side: a different order of magnitude
The fish in the database peak far lower, again per 100 g:
| Food | Omega-3 per 100 g |
|---|---|
| Sardine, in tomatosauce, canned | 2.5 g |
| Sardine in oil, drained | 2.43 g |
| Salmon, cultured, raw | 2.1 g |
| Salmon, cultured, filet, steamed | 1.84 g |
| Rollmops (pickled herring) | 1.53 g |
| Fish fingers (breaded and pre deep fried), fried in HOLL rapeseed oil | 1.36 g |
| Trout, raw | 1.23 g |
| Trout, smoked | 1.18 g |
Raw farmed salmon shows 2.1 g and raw trout 1.23 g. Between the first oil and the first fish the gap is close to a factor of twenty. Preparation matters too: the steamed farmed-salmon fillet drops to 1.84 g, because the content per 100 g follows the water and fat lost or taken up during cooking.
Why comparing an oil and a fish per 100 g has limits
Per 100 g is the only common basis for comparing two compositions. It does not, however, describe two comparable situations: an oil is used in small amounts, as a cooking fat or a dressing, while a fish makes up the main part of a dish. Reading 49.82 g against 2.5 g without allowing for that difference in use means confusing two scales.
Three reading points:
- the displayed content is a sum: it does not say how much belongs to ALA, EPA or DHA;
- the preparation state is part of the official label and changes the value per 100 g;
- with no reference value, no percentage puts the figure in perspective.
The food comparison tool places two foods side by side, line by line, total fat and polyunsaturated fat included.