Fruit
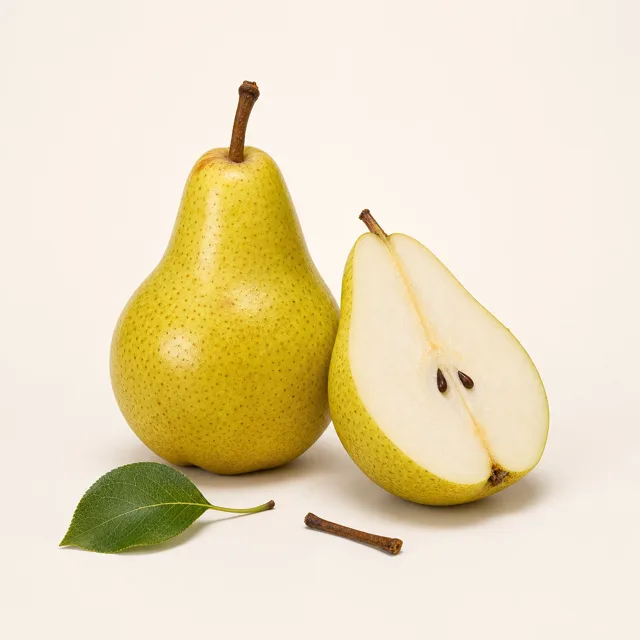
Pear, raw
Fresh fruit
54 kcal / 100 g
FSVO V7.1
100 g of Pear, raw provides 54 kcal (227 kJ). Energy density and nutrient contents are detailed below, value by value. This food belongs to the “Fresh fruit” category (“Fruit” family) of the Swiss database.
The essentials for 100 g
Protein0.5 g
1%
Fat0.3 g
0%
Carbohydrates10.9 g
4%
Dietary fibre2.9 g
10%
% of nutrient reference values (adults), for the displayed portion.
Detailed composition
for 100 g| Nutrient | Value | % NRV* |
|---|---|---|
| Macronutrients | ||
| Energy | 54 kcal (227 kJ)C | 3% |
| Protein | 0.5 gA | 1% |
| Fat | 0.3 gA | 0% |
| of which saturated fat | 0.1 gA | 1% |
| of which polyunsaturated | 0.1 gA | n/a |
| of which omega-3 | 0 gC | n/a |
| Carbohydrates | 10.9 gA | 4% |
| of which sugars | 9 gA | 10% |
| Dietary fibre | 2.9 gA | 10% |
| Water | 83.5 gA | n/a |
| Alcohol | 0 gE | n/a |
| Minerals | ||
| Calcium | 7 mgA | 1% |
| Iron | 0.1 mgA | 1% |
| Magnesium | 8 mgA | 2% |
| Phosphorus | 15 mgA | 2% |
| Potassium | 130 mgA | 7% |
| Sodium | 2 mgA | 0% |
| Zinc | 0.1 mgA | 1% |
| Vitamins | ||
| Vitamin D | 0 µgE | 0% |
| Vitamin B12 | 0 µgE | 0% |
| Vitamin C | 5 mgA | 5% |
| Folate | 12 µgA | 6% |
* Share of the nutrient reference values for adults (Swiss FIC ordinance, annex 10), for the displayed portion. For dietary fibre the annex sets no value: the 30 g a day is an indicative benchmark. “n/a”: value not available in the source, never estimated by us. A, E or C indicates each value’s origin.