Compare
Green peas and carrots, canned vs Green peas, canned: nutrition comparison
Per 100 g: 68 kcal for Green peas and carrots, canned, versus 87 kcal for Green peas, canned, a difference of 19 kcal. The full breakdown, nutrient by nutrient, from the FSVO database V7.1.
Green peas and carrots, canned
Cooked vegetables (incl. cans)100 g
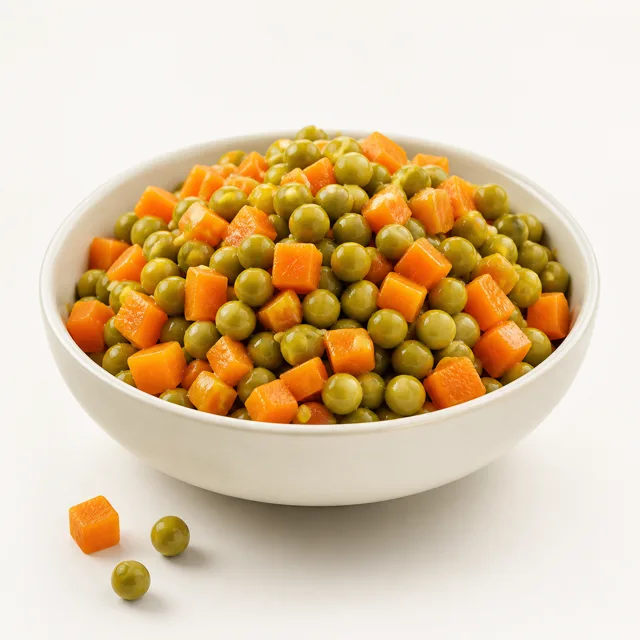
Protein4.2 g
4.2 g
Fat0.6 g
0.6 g
Vitamin D0 µg
0 µg
Omega-30 g
0 g
Energy68 kcal
68 kcal
Protein−0.6 g
Fat−0.2 g
Vitamin Dequal
Omega-3equal
Energy−19 kcal
Green peas, canned
Cooked vegetables (incl. cans)100 g
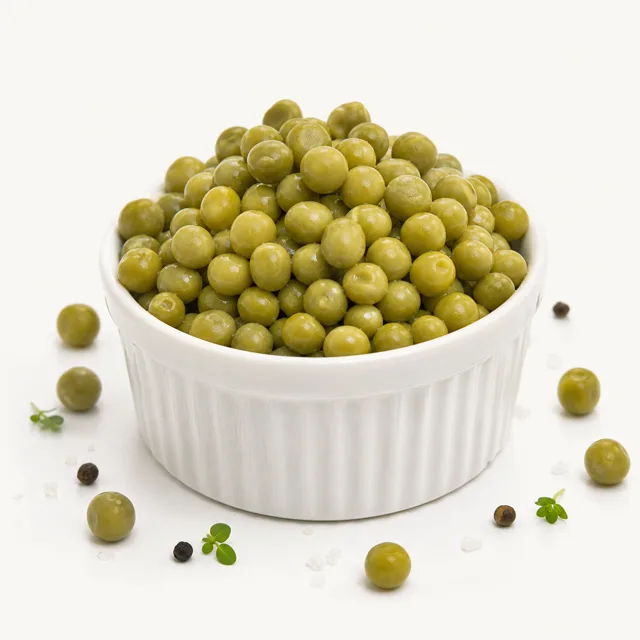
Protein4.8 g
4.8 g
Fat0.8 g
0.8 g
Vitamin D0 µg
0 µg
Omega-30.1 g
0.1 g
Energy87 kcal
87 kcal
Highest vitamin C content
Green peas and carrots, canned contains 17 mg more vitamin C per 100 g.
Highest folate content
Green peas and carrots, canned contains 19 µg more folate per 100 g.
Highest iron content
Green peas, canned contains 0.9 mg more iron per 100 g.
Full comparison, nutrient by nutrient
Per 100 g. In green: the higher of the two contents. “n/a”: not available in the source.
| Per 100 g | Green peas and carrots, canned | Green peas, canned |
|---|---|---|
| Macronutrients | ||
| Energy | 68 kcal | 87 kcal |
| Protein | 4.2 g | 4.8 g |
| Fat | 0.6 g | 0.8 g |
| of which saturated fat | 0.1 g | 0.1 g |
| of which polyunsaturated | 0.2 g | 0.4 g |
| of which omega-3 | 0 g | 0.1 g |
| Carbohydrates | 9.6 g | 12.8 g |
| of which sugars | 3.8 g | traces |
| Dietary fibre | 4.1 g | 5 g |
| Water | 81.8 g | 76 g |
| Alcohol | 0 g | 0 g |
| Minerals | ||
| Calcium | 38 mg | 32 mg |
| Iron | 0.7 mg | 1.6 mg |
| Magnesium | 18 mg | 21 mg |
| Phosphorus | 44 mg | 83 mg |
| Potassium | 200 mg | 120 mg |
| Sodium | 410 mg | 270 mg |
| Zinc | 0.4 mg | 0.6 mg |
| Vitamins | ||
| Vitamin D | 0 µg | 0 µg |
| Vitamin B12 | 0 µg | 0 µg |
| Vitamin C | 26 mg | 9 mg |
| Folate | 59 µg | 40 µg |
Keep comparing
- Full page: Green peas and carrots, canned
- Full page: Green peas, canned
- Sweet corn canned or Green peas (canned), heated (without addition of salt): the comparison
- Sweet corn canned or Sweet corn, steamed: the comparison
- Green bean, dried, soaked, steamed (without addition of salt) or Green peas, canned: the comparison
- Sweet corn, steamed or Green peas, canned: the comparison
- Onion, roasted, brown (without addition of fat and salt) or Green peas, canned: the comparison
- Celeriac slices, breaded, prepared or Green peas, canned: the comparison
- Adjust this comparison in the tool